I am an experienced reliability engineering and management consultant with my firm FMS Reliability. My passion is working with teams to create cost-effective reliability programs that solve problems, create durable and reliable products, increase customer satisfaction, and reduce warranty costs.
View all posts by Fred Schenkelberg →
How many times have you been given only MTBF, a single value? The data sheet or sales representative or website provides only MTBF and nothing more. We see it all the time, right? It is provided as the total answer to “what is the reliability performance expectation?”
So, given MTBF what do we really know about reliability?
Time to move on from Mean Time Between Failure (MTBF) and Mean Time To Failure (MTTF)
Guest Post by Dan Burrows
Reliability, Quality, Six Sigma, & Performance Improvement Leader
sean dreilinger rachel opens reliable design of medical devices – a textbook that nobody else would dare to read.
The reliability profession has historically embraced two metrics, Mean Time Between Failure (MTBF) for repairable items and Mean Time To Failure (MTTF) for non-repairable items. They did this mostly out of convenience when dealing with large populations such as fleets of vehicles to address the random failures that were being experienced and to make the mathematics simple. And this approach worked fairly well before better approaches came into play. But this approach also worked fairly well because other reliability and maintainability practices were also enforced, namely planned/preventive/scheduled maintenance whereby serviceable items were serviced to keep them in proper operating condition, wearable items were replaced or restored, life limited items were replaced and good operating and failure data was kept. Without enforcing the maintainability and good data side of this, MTBF and MTTF become misleading at the least and dangerous in many cases.
Thus, MTBF or MTTF could address the flat portion of the traditional “Bathtub Curve”. Proper maintenance could address the wearout/life limit portion of the bathtub curve. And screening and run in/burn in could mitigate the early failure portion of the bathtub curve.
Traditional Bathtub Curve
So, there are four big mistakes that people often make with MTBF and MTTF related to the bathtub curve:
Mistake #1: MTBF and MTTF are erroneously used as projections of product useful life.
Mistake #2: MTBF and MTTF assume a constant failure rate during the useful life of the item.
Mistake #3: MTBF and MTTF are given an assumption of high likelihood that the product will make it to the value.
Mistake #4: MTBF and MTTF data is assumed to be good and current.
Let’s take a closer look at these four big mistakes…
Mistake #1: MTBF and MTTF are erroneously used as projections of product useful life
Let’s take a common example. Electrolytic capacitors can have MTBF (actually should be stated MTTF since they are not repairable) values of 108 (one hundred million) or 109 (one billion) hours. If one were to divide these numbers by hours in a year to project useful life, this would result in a useful life of 11,415 to 114,155 years! In reality, electrolytic capacitors, if derated and applied properly typically have a useful life of 10 to 20 years. This is because the electrolyte in electrolytic capacitors dissipates, drying up the capacitor, causing significant degradation in performance (capacitance, leakage current, or ESR) or outright open or short failure. This doesn’t mean that electrolytic capacitors are necessarily bad, just that they don’t live for 10,000+ years.
So, how should MTBF and MTTF be used? They should be used as indicators of failure rate during the useful life of the product. So, you take the MTBF or MTTF value and invert it, dividing 1 by it. This gives you the expected failure rate per operating hour for the product during its useful life. So, our electrolytic capacitors that have a MTBF of 108 (one hundred million) or 109 (one billion) hours actually have an expected failure rate of 1 to 10 x 10-9 failures per operating hour. It is possible that they will be very reliable during their 10 to 20 year useful life, but then they are dried out and done.
Using MTBF or MTTF values as projections of product useful life is extremely misleading and will probably get you laughed out of your job. Think about that before you improperly use MTBF or MTTF to claim that a product will last 10,000 years. Somebody may ask for a warranty that long. In writing.
Mistake #2: MTBF and MTTF assume a constant failure rate during the useful life of the item.
Many products do not exhibit a constant failure rate. Especially if the early failures were not mitigated and the product was not properly maintained. MTBF and MTTF only address the portion of the product’s failure population that arise out of random chance and apply a very simplistic “mean” by dividing the total operating time of the product population by the total number of failures. This is then made to look scientific by then stating that this is an exponential distribution whereby the failures that arose in the population were evenly distributed with no proof of even distribution. But the world is not random and failures do not arrive at a constant rate over the life of the product or product population. Most product failures happen in non-exponential distribution, non-random patterns for identifiable reasons.
Let’s say you have a product population of five products with the following failure times: 98, 99, 100, 101, 102. If you use the standard MTBF averaging, you have a MTBF of 100 hours. But these failures are not randomly distributed with a constant failure rate. They are clustered around 100 hours and there is probably an identifiable reason why.
Let’s say you have a product population of five products with the following failure times: 10, 10, 10, 235, 235. Again, if you use the standard MTBF averaging, you have a MTBF of 100 hours. It is obvious that there is something going on that caused three products to have a very short life and two products to have a much longer life. Either way, there is probably an identifiable reason why three products failed early and two lived much longer.
Assuming a constant failure rate and using simple averaging of failure times to come up with MTBF or MTTF values is lazy at best. Don’t be lazy, investigate failures to find root causes. These root causes will help you determine how to design products to eliminate the failure, mitigate against the failure, or perform proper preventive and predictive maintenance to avoid the failure.
Mistake #3: MTBF and MTTF are given an assumption of high likelihood that the product will make it to the value.
Even if we do mitigate early life failures and perform proper maintenance, most people assume that the MTBF or MTTF is a value with high statistical likelihood like a B10 life (the point at which 10% of products fail and 90% continue to survive) for bearings. Due to the constant failure rate assumption and underlying statistical distribution, MTBF and MTTF are actually the point at which 63% of products would have failed and only 37% survive. Some high likelihood, — recall that MTBF is the inverse of the failure rate, not a duration.
You can check the math yourself. The probability of survival of a product following the constant failure rate of the exponential distribution is e-(1/MTBF)(Operating Time). So, a product with a MTBF of 200,000 hours will have a probability of survival of e-(1/200,000)(200,000) or 37%.
Assuming MTBF and MTTF are high likelihood projections is actually almost the exact opposite of how the math really works out. Use MTBF and MTTF with high caution, not high trust.
Mistake #4: MTBF and MTTF data is assumed to be good and current
Even if you make it past the first three mistakes, this fourth mistake usually throws a wrench in MTBF and MTTF because many of the prediction models and prediction tools being sold are based on outdated information and outdated technologies. One example of this is using a MTBF prediction model for a flash memory device. Most of the data behind prediction tools stopped getting updated when the United States Defense Department transitioned to commercial off the shelf acquisition practices and stopped funding the collection of component operating and failure data. One example is many models for flash memory include devices that have 256K or 512K capacity while the world has moved way past this.
Assuming that the information in prediction models and tools is good and current may lead you to making extremely erroneous predictions of MTBF and MTTF. If you are going to predict MTBF or MTTF, you need to either have collected the operating and failure data yourself and analyzed it properly or make sure that component suppliers are providing good data.
Time to move on…
MTBF and MTTF may have had a brief time in the spotlight of reliability when items were screened for early defects and maintained properly, good data was kept, and people didn’t know how to or didn’t know better about uncovering root causes of failures and designing them out or mitigating them. But that past is past. It is time to move on from MTBF and MTTF to more effective methods to drive reliability.
Maybe you are one of the lucky ones who deal with large product populations, products are all properly maintained, and you keep good data so the MTBF and MTTF math still holds.
Good for you.
Most of us live in a demanding world with demanding customers and demanding bosses and tight schedules and limited resources. Customers don’t want to hear about averages that have low confidence levels, they expect the product they bought to live its expected usage life. Bosses don’t want to hear about the huge number of product samples needed to test and huge amount of field data needed to statistically derive the proper failure distribution analysis, they want to know why the product has not launched yet.
Reliability professionals in today’s world have to understand more and guide product teams to:
Design for Reliability for proper application, design margin, and derating.
Design for Maintainability to address issues that must be mitigated by maintenance when the needed product life reliability cannot be achieved without maintenance actions.
Failure Mode and Effects Analysis (FMEA) and Fault Tree Analysis (FTA) to determine the risks to the product based on severity, occurrence, and detection to drive actions to drive down risk before it becomes realized.
Reliability Testing to aggressively test and discover failures, at what point failures occur, and how much reliability margin the product will have to drive actions to correct the weak links in the design.
Design for Manufacturability to preserve the designed in reliability of the product during its manufacture.
Get Good Data from your own test and field history and supplier data you can trust instead of relying on generic and often outdated and obsolete prediction data. Data for your products in your customer’s hands tells you the real story of how your products are actually performing in their actual (and sometimes surprising) usage applications and operating environments.
When you say ‘… uses MTBF’? What is it you’re implying? Do they make important business decisions, or assess product designs, or order spares based on using MTBF?
Probably not.
When you use MTBF, what do you use it to accomplish?
Do you write a report and send it to the requesting team?
Do you run a calculation and provide the resulting MTBF to customers or vendors?
Do you or anyone in your organization use MTBF in a useful manner.
And, if so, does it work for you? Does MTBF actually provide a useful metric related to your product’s reliability performance?
In my experience, MTBF and related metrics are great for meeting requirements or fulfilling requests, not much else. They are not useful for decision making. MTBF is next to useless when ordering spares. And, it is so commonly misunderstood that the report values are often simply misleading.
Do you receive request for MTBF from customers or internal teams? What do they use MTBF to accomplish? Check of as done?
Some may claim they use MTBF as a comparison to previous products. Some claim it provides an insights to the expected reliability performance. Some really do not know what do with MTBF so just ignore the value.
When gathering data for a part count prediction (aka Mil Hdbk 217 or similar) do you request MTBF values? Is so, do you also ask about failure mechanisms, derating parameters, or how/what will most likely fail?
Simply taking the MTBF value provided reinforces that notion that ‘everybody uses MTBF’ and does not provide you or your team useful information.
Data sheets, vendor websites, reliability reports, etc. all contain MTBF (sometimes called life, or reliability, yet the most common reported metric is MTBF or something similar).
MTBF is around us, built into tools, and expected. My contention is that even though it is not useful, it is so common, that it is assumed everybody uses MTBF.
Don’t be Everybody.
You will do a better job reporting reliability as couplets of probability of success and duration, rather than MTBF.
Do something that is useful and easy to use. Do not use MTBF. Be better than everybody. Add value to your organization, to your team, to your customers. Help others by your example, to be like you and not like everybody else.
I’m on vacation and this is just a quick post for the week. The top five posts of NoMTBF.com by visits to date.
How to Calculate MTTF is probably popular as folks may be searching for a way to do this calculation. It’s actually very simple, yet this article asks why would you want to calculate MTBF?
Set a Reliability Goal without MTBF is another recent article and may have gather interest given it may seem impassable to set a goal without MTBF. It is possible and actually useful.
What is the purpose of Reliability Predictions is a guest post by Andrew Roland (3 of the top 5 are guest posts…) where he examines the useful use of predictions and where many have gone astray assuming a use.
Where does 0.7eV Come From – well, actually the activation energy that represents a doubling of rate in a chemical reaction with an increase in temperature of about 10°C is 0.7eV – beyond that Kirk explores the ramifications.
Back at my office next week, and home to find a few more record breaking articles to post. Plus, if you’re interesting in writing a post, either a problem with solution, a case study, or common issue with assumptions related to reliability – let’s see how it does with visits and views.
Sure, it would be easy to use MTBF for a system reliability goal. Your organization has regularly used MTBF. Your customers are asking for MTBF. The competition all use MTBF. Even your vendors supply only MTBF.
Yet, you know it’s not the best metric to use. It’s not accurate, it’s not useful, and you rather use something else.
How does your equipment fail? How do you plan for spares? Do you use your existing failure data to help refine your maintenance planning?
Given the title of the article, these questions are reasonable. As either a plant reliability or maintenance engineer do you also rely on gut feel to refine your estimates? If you rely on MTBF or similar metrics, you most likely do not trust the data to provide useful answers. Continue reading Maintenance and Statistics Without MTBF→
In the section on predictions you mention Dr. Box’s oft quoted
statement that “..all models are wrong, but some are useful.” In the
same book Dr. Box also wrote, “Remember that all models are wrong; the
practical question is how wrong do they have to be to not be useful.” [see these and other quote by Dr. George Box here]
Reliability predictions are intended to be used as risk and resource
management tools. For example, a prediction can be used to:
Compare alternative designs.
Used to guide improvement by showing the highest contributors to failure.
Evaluate the impact of proposed changes.
Evaluate the need for environmental controls.
Evaluate the significance of reported failures.
None of these require that the model provide an accurate prediction of
field reliability. The absolute values aren’t important for any of the
above tasks, the relative values are. This is true whether you express
the result as a hazard rate/MTBF or as a reliability. Handbook methods
provide a common basis for calculating these relative values; a
standard as it were. The model is wrong, but if used properly it can
be useful.
Think about the use of RPN’s in certain FMEA. The absolute value of
the RPN is meaningless, the relative value is what’s important. For
sure, an RPN of 600 is high, unless every other RPN is greater than
600. Similarly, an RPN of 100 isn’t very large, unless every other RPN
is less than 100. The RPN is wrong as a model of risk, but it can be
useful.
I once worked at an industrial facility where the engineers would dump
a load of process data into a spreadsheet. Then they would fit a
polynomial trend line to the raw data. They would increase the order
of the polynomial until R^2 = 1 or they reached the maximum order
supported by the spreadsheet software. The engineers and management
used these “models” to support all sorts of decision making. They were
often frustrated because they seemed to be dealing with the same
problems over and over. The problem wasn’t with the method, it was
with the organization’s misunderstanding, and subsequent misuse, of
regression and model building. In this case, the model was so wrong it
wasn’t just useless, it was often a detriment.
Reliability predictions often get press. In my experience, this is
mostly the result of misunderstanding of their purpose and misuse of
the results. I haven’t used every handbook method out there, but each
that I have used state somewhere that the prediction is not intended to
represent actual field reliability. For example, MIL-HDBK-217 states,
“…a reliability prediction should never be assumed to represent the expected field reliability.”
I think the term “prediction” misleads
the consumer into believing the end result is somehow an accurate
representation of fielded reliability. When this ends up not being the
case, rather than reflecting internally, we prefer to conclude the
model must be flawed.
All that said, I would be one of the first to admit the handbooks could
and should be updated and improved. We should strive to make the
models less wrong, but we should also strive to use them properly.
Using them as estimators of field reliability is wrong whether the
results are expressed as MTBF or reliability.
Really? Is MTBF the only way to work with reliability growth?
Received this question via LinkedIn (feel free to connect with me there) and hadn’t given it much thought before. I am familiar with a few growth models and regularly have seen MTBF in use. Thus discounted the modeling as an approach of little interest to me or my clients.
MTBF measures the inverse of the average failure rate, when in many cases we really want to know about the first or tenth percentile of time to failure. Measuring and tracking the average time to failure provides little information about the onset of the first few failures.
The Homogeneous Poisson Process (HPP) when the failure rate is constant over the time period of interest. This relies on the exponential distribution and the assumption of a stable and random arrival of failures, which is almost always not true (in my experience). It’s a convenient assumption as it makes the math a lot simpler, yet provides only a crude model and poor results.
The Non-Homogeneous Poisson process (NHPP) Power Law and Exponential Law models provide information based on the cumulative number of failures over time. These models rely on the notion that any system has a finite number of design errors that once resolved create a system that has a HPP behavior.
Duane Plot provides a graphical means to show cumulative failures over time. When the arrival of failures slows the curve decreases in slope effectively bending over. This provides a means to estimate the final failure rate (average unfortunately).
What I use instead
Given my dislike of all things MTBF, I’ve not used these model to estimate MTBF. Instead stay with the Duane plot and graphically track when the team is finding and fixing enough faults in the design.
I also tend to use reliability block diagrams (RBD) with each block modeled with the appropriate reliability distribution. For a series model then all we need to do is multiple the reliability value from each block for time t (say warranty period, or mission time, etc.) to estimate the system reliability at time t.
For complex systems with some amount of redundancy the RBD does get a bit more complicated. For very complex systems with degraded modes of operation or significant repair times then use Petri Nets or Markov Models to properly model.
In the vast majority of cases a simple RBD is sufficient to capture and understand the reliability of a system. This allows the team to focus on improving weak areas and reduce uncertainty though improving reliability estimates. An RBD does not require nor assume an exponential distribution and the math is easy enough to manage, often even in your favorite spreadsheet.
Summary
Reliability growth starts with model of the estimated number of failures over a time period. Testing then provides a value for that estimate. This does not require the use of MTBF, so instead of assuming a constant failure rate, focus on the failure mechanisms and use a simple RBD to build a system model. The reliability growth is the result of identifying areas for improvement and doing the improvement. RBD, in my experience, provides a great way to communicate with the team where to focus improvements.
Over the past week I’ve seen or received a couple of questions about MTTF. One was on how to use failure data to calculate MTTF, another on how to estimate Weibull parameters after assuming a constant rate of failure.
Do you check assumptions? Not all assumptions are equal as some may lead you to a costly decision.
We regularly make assumptions about the uniformity of material, the consistency of part to part performance, and many other engineering elements of a design or process. We have to simply the problems we face in order to work out solutions and make decisions. Continue reading How to Justify Using the Exponential Distribution→
No. You should not use MTBF when designing or scheduling maintenance programs or tasks. Furthermore, it is a very poor metric to monitor equipment performance.
The basic calculation of MTBF (or MTTF) and assuming the equipment time-to-failure distribution is the exponential distribution implies the equipment downing event occurs randomly. In other word the equipment doesn’t break in and actually lower it’s chance for failure over time, nor exhibit wear out or the increase of failure rates over time.
The chance of failure is constant over time and does not change given the time the system or component has been in service.
MTBF dose provide the average time between failures and does not provide any information about when the failures may occur if the actually failure do not occur randomly. Furthermore the exponential distribution has a memoryless feature, meaning a motor that is brand new and a similar motor with1,000,000 hours of service each have the same chance to fail in the next hour.
The MTBF calculation or vendor supplied value does not include information about how the failure rate may change over time.
Wear Out and Maintenance Planning
Let’s use a motor as an example for a simple maintenance planning exercise. Let’s say the motor has an MTBF of 100,000 hours provided by the vendor. There isn’t any maintenance on the motor, such as lubrication or alignment checks, yet we are planning to use 100 motors in the plant and need to plan for spares.
How many spares will we need over the next year to replace faulty motors.
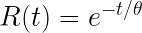
Using just MTBF, we can use the probability of successful operation over the year, 8760 hours, and quickly estimate how many of the 100 motors will require replacement.
t is 8760 hours
θ is the MTBF or 100,000 hours
Thus, we find 91.6% of units should survive one year of operation. That means out of 100 installed motors, we expect about 8.4% to fail, or 8 or 9 units. Of course we could add a confidence bound to this calculation plus include the time the replacement unit operate for a bit more accuracy. For this example we’ll keep it simple.
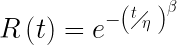
Yet, we know based on experience with other similar motors that they rarely fail during the first year. With a little work we find the motors do actually wear out primarily due to bearing wear. And another call to the vendor we find they recommend using the Weibull distribution with β of 2 and η of 90,000 hours.
The reliability function for the Weibull distribution is
Where η is the characteristic life, in this case 90,000 hours
And, β is 2.
Thus over one year we would expect 99% of the motors to survive, meaning only 1 is expected to fail.
Using MTBF would have us buy 7 or 8 extra spares unnecessarily.
Maintenance Scheduling
We know that motors wear out. Given only MTBF and the exponential distribution assumption we do not have sufficient information to schedule motor replacements.
If the motors actually failed randomly, as assumed, then our only strategy is to replace motors as they fail. Since the chance to fail each hour remains constant arbitrarily replacing motors at a any point in time will not avert or change the chance of failure the next hour.
When we model the wear out behavior, I.e. Weibull distribution with β of 2, then we can calculate the time at which the chance of failure is economically unacceptable. For example, if we typically operation in 1 week shifts of 168 hours then have time for maintenance tasks, we can calculate the chance of failure over a week period after one year, two years, etc. And determine when the chance of failure becomes unacceptable.
Knowing how the failure rate changes over time we can schedule replacements and maintain a relatively lower overall failure rate.
Summary
Find or estimate the information concerning the changing rate of failure over time. Ignoring wear out or early failures by using MTBF only will cost you and your plant money.
Understanding and modeling the wear out patterns allows you to secure spares as needed. You can avoid costly downtime by doing replacements before the chance of failure is too high.
PS: I’m working on examples and update to the draft book on MTBF to include more maintenance reliability specifics.
Every now and then we need to ask a supplier for a reliability estimate for a component they produce. Our team may be considering adding the part to a system and would like to know if it is reliable enough to meet our needs. Continue reading How to Ask for Component Reliability Information→