 Are the Measures Failure Rate and Probability of Failure Different?
Failure rate and probability are similar. They are slightly different, too.
One of the problems with reliability engineering is so many terms and concepts are not commonly understood.
Reliability, for example, is commonly defined as dependable, trustworthy, as in you can count on him to bring the bagels. Whereas, reliability engineers define reliability as the probability of successful operation/function within in a specific environment over a defined duration.
The same for failure rate and probability of failure. We often have specific data-driven or business-related goals behind the terms. Others do not.
If we do not state over which time period either term applies, that is left to the imagination of the listener. Which is rarely good.
Failure Rate Definition
There at least two failure rates that we may encounter: the instantaneous failure rate and the average failure rate. The trouble starts when you ask for and are asked about an item’s failure rate. Which failure rate are you both talking about?
The instantaneous failure rate is also known as the hazard rate h(t)


Where f(t) is the probability density function and R(t) is the relaibilit function with is one minus the cumulative distribution function. The hazard rate, failure rate, or instantaneous failure rate is the failures per unit time when the time interval is very small at some point in time, t. Thus, if a unit is operating for a year, this calculation would provide the chance of failure in the next instant of time.
This is not useful for the calculation of the number of failures over that year, only the chance of a failure in the next moment.
The probability density function provides the fraction failure over an interval of time. As with a count of failures per month, a histogram of the count of failure per month would roughly describe a PDF, or f(t). The curve described for each point in time traces the value of the individual points in time instantaneous failure rate.
Sometimes, we are interested in the average failure rate, AFR. Where the AFR over a time interval, t1 to t2, is found by integrating the instantaneous failure rate over the interval and divide by t2 – t1. When we set t1 to 0, we have

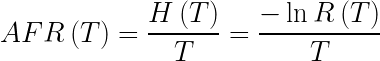
Where H(T) is the integral of the hazard rate, h(t) from time zero to time T,
T is the time of interest which define a time period from zero to T,
And, R(T) is the reliability function or probability of successful operation from time zero to T.
A very common understanding of the rate of failure is the calculation of the count of failures over some time period divided by the number of hours of operation. This results in the fraction expected to fail on average per hour. I’m not sure which definition of failure rate above this fits, and yet find this is how most think of failure rate.
If we have 1,000 resistors that each operate for 1,000 hours, and then a failure occurs, we have 1 / (1,000 x 1,000 ) = 0.000001 failures per hour.
Let’s save the discussion about the many ways to report failure rates, AFR (two methods, at least), FIT, PPM/K, etc.
Probability of Failure Definition
I thought the definition of failure rate would be straightforward until I went looking for a definition. It is with trepidation that I start this section on the probability of failure definition.
To my surprise it is actually rather simple, the common definition both in common use and mathematically are the same. There are two equivalent ways to phrase the definition:
- The probability or chance that a unit drawn at random from the population will fail by time t.
- The proportion or fraction of all units in the population that fail by time t.
We can talk about individual items or all of them concerning the probability of failure. If we have a 1 in 100 chance of failure over a year, then that means we have about a 1% chance that the unit we’re using will fail before the end of the year. Or it means if we have 100 units placed into operation, we would expect one of them to fail by the end of the year.
The probability of failure for a segment of time is defined by the cumulative distribution function or CDF.
When to Use Failure Rate or Probability of Failure
This depends on the situation. Are you talking about the chance to failure in the next instant or the chance of failing over a time interval? Use failure rate for the former, and probability of failure for the latter.
In either case, be clear with your audience which definition (and assumptions) you are using. If you know of other failure rate or probability of failure definition, or if you know of a great way to keep all these definitions clearly sorted, please leave a comment below.
Hi Fred,
Engineers should understand that the mathematics of survival analysis is the invention of mathematicians. Engineers muddy the waters by calling different things failure rates. The probability density function (f(t)) is the probability of failure in a small interval per unit time. The hazard rate (h(t)) is the probability of failure during a very small time interval assuming the individual has survived to the beginning of that interval. f(t) is also known as the unconditional failure rate, whereas h(t) is known as the conditional failure rate. In your article, you miss this important assumption in your definition of the hazard rate.
The relationship between f(t) and h(t) is h(t) = f(t) / 1 – F(t) = f(t) / S(t), not h(t) = f(t) / F(t) as you have in your article.
“A very common understanding of the rate of failure is the calculation of the count of failures over some time period divided by the number of hours of operation.” This is the MLE of the exponential scale parameter (lambda). Thus, there’s an underlying assumption that failure times are s-exponentially distributed in this definition. This doesn’t work for other s-distributions and is probably part of the reason people run around using MTBF as a metric.
Thanks for the comment Rowland. I updated the text and formula for the hazard function h(t) – my bad.
I agree that as engineers we are not often precise when using these terms. Which is probably (no pun intended) why the question arose concerning the definitions.
When I set out to answer the question I thought I could grab Practical Reliability Engineering and look up the two definitions and be done… first I ended up checking about 10 books on my shelf on reliability engineering and found some did not define failure rate at all, and there wasn’t a consensus on the definitions I did find.
The count of failures over total time is not only the MLE estimate for lambda, it’s also just a ratio of two numbers providing a means to summarize the proportion of failures over some time frame. So, we could make the exponential assumption or not.
I like the conditional and un-conditional explanation, that helps somewhat. What I don’t fully understand is the difference between a small interval and very small interval. h(t) has the element of delta t going to zero, if I recall one of the references discussion about hazard rate.
Cheers,
Fred
Great post Fred,
I come to this issue when I was asked to give an awareness session to Criticality Assessment team.
I give the following example:
Assume you are driving a car, CDF Is the total distance you crossed PDF is the nature of road Failure Rate is the speedometer.
If the road is straight, you will drive with a constant speed.
I’m not sure if this fit mathematicaly, but it was demonstrating the changes in the four function in a nice way.
Regards
I like it – easy to remember, which helps. Thanks for the comment Ammar. cheers, Fred
Fred,
In either case the (very) small interval tends to zero in the limit (delta t -> 0). The important difference is the assumption the individual has survived to the beginning of the interval.
In the exponential case, the unconditional failure rate
f(t) = lambda * exp(-lambda * t)
and the conditional failure rate (hazard rate)
h(t) = lambda
In reliability, it’s generally the conditional failure rate ( hazard rate) that we’re referring to regardless of the s-distribution in question. It’s probably worth pointing out that the “bathtub curve” is a plot of the conditional failure rate (hazard rate) over time.
I agree N / T is a ratio of two numbers regardless of the underlying s-distribution. In the case of the exponential distribution, this ratio is an estimate of the hazard rate because the hazard rate is time independent. However, if failure times are Weibull, gamma, lognormal, etc. distributed, how does this ratio really help? When you use that ratio, you ARE making the implicit assumption of exponentially distributed failure times.
Regards,
Andrew
Hi Fred
There is no doubt that reference in reliability are confusing on the matter. Failure rate or instantaneous failure rate cannot be probability (or chance) of failure because failure rate can be bigger than one. I realized this when I encountered a data set with Weibull Shape 46 and Scale 12 years. Any kind of failure rate is simply the number of failures per unit time interval. For practical reasons failure rate can be regarded as probability as long as this is small numbers, however, this will be a mere assumption.
Regards
Hammad Awan
Yes there are many issues with using failure rate – especially with repairable systems. cheers, Fred