Category Archives: MTBF

Mean Time Between Failures or MTBF is a common metric for reliability and is often misused or misunderstood.

Plot the Data

Plot the Data

Just, please, plot the data.

If you have gathered some time to failure data. You have the breakdown dates for a piece of equipment. You review your car maintenance records and notes the dates of repairs. You may have some data from field returns. You have a group of numbers and you need to make some sense of it.

Take the average

That seems like a great first step. Let’s just summarize the data in some fashion. So, let’s day I have the number of hours each fan motor ran before failure. I can tally up the hours, TT, and divide by the number of failures, r. This is the mean time to failure.

\displaystyle \theta =\frac{TT}{r}

Or, if the data was one my car and I have the days between failures, I can also tally up the time, TT, and divide by the number of repairs, r. Same formula and we call the result, the mean time between failure.

And I have a number. Say it’s 34,860 hours MTBF. What does that mean (no pun intended) other than on average my car operated for 34k hours between failures. Sometimes more, sometimes less.

Any pattern? Is my car getting better with age, or worse?

A Histogram

In school we used to use histograms to display the data. Let’s try that. Here’s an example plot.


Screen Shot 2015-08-05 at 8.01.58 AM In this case the plot is of service and repair times (most likely similar to the times the garage has my car for a oil change and tune up). Right away we see more than just a number. The values range from about 50 up to about 350 with most of the data on the lower side. Just a couple of service times take over 250 minutes.

Using just an average doesn’t provide very much information compared to a histogram.

Mean Cumulative Function Plot

Over time count the number of failures. If the repair time is short compared to operating time, than this simple plot may reveal interesting patterns that a histogram cannot.

Here is a piece of equipment and each dot represented a call for service. The x-axis is time and the vertical axis is the count of service calls. While it’s not clear what happened shortly after about 3,000 hours, it may be worth learning more about what was going on then.

M90-P4 MCF


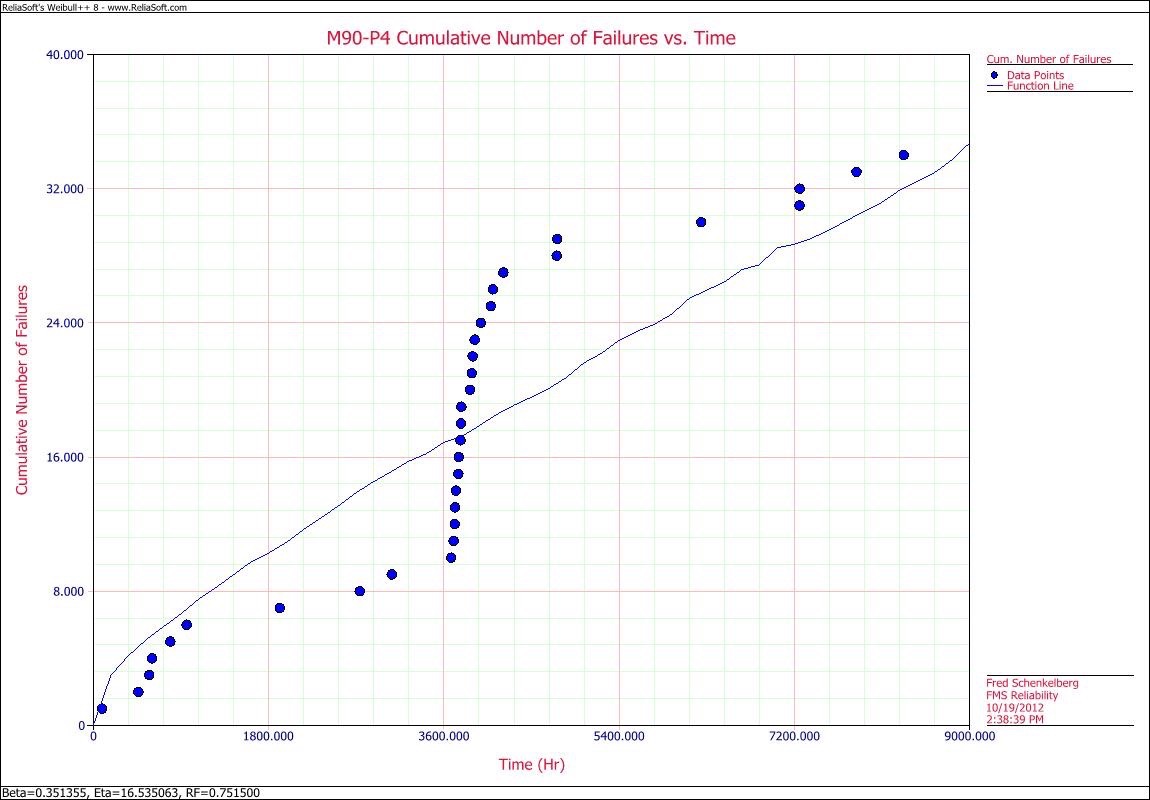
Even after the first there or four point after 3,000 hours would have signaled something different is happening here.
MCF plots show when something is getting worse (more frequent repairs) by curving upward, or getting better, (longer spans between repairs) by flattening out. Again, a lot more information than with just a number.

Plot the Fitted Distribution

Let’s say we really want to assume the data is from an exponential distribution. We can happily calculate the MTBF value and continue with the day. Or, we can plot the data and the fitted exponential distribution.

Let’s say we have about five failure times based on customer returns out of the 100 units placed into service. We can calculate the MTBF value including the time the remaining 95 units operated, which is about 172,572 hours MTBF. And, we can plot the data, too.

Here’s an example. What do you notice, even with a fuzzy plot image?

Exp assumed plot


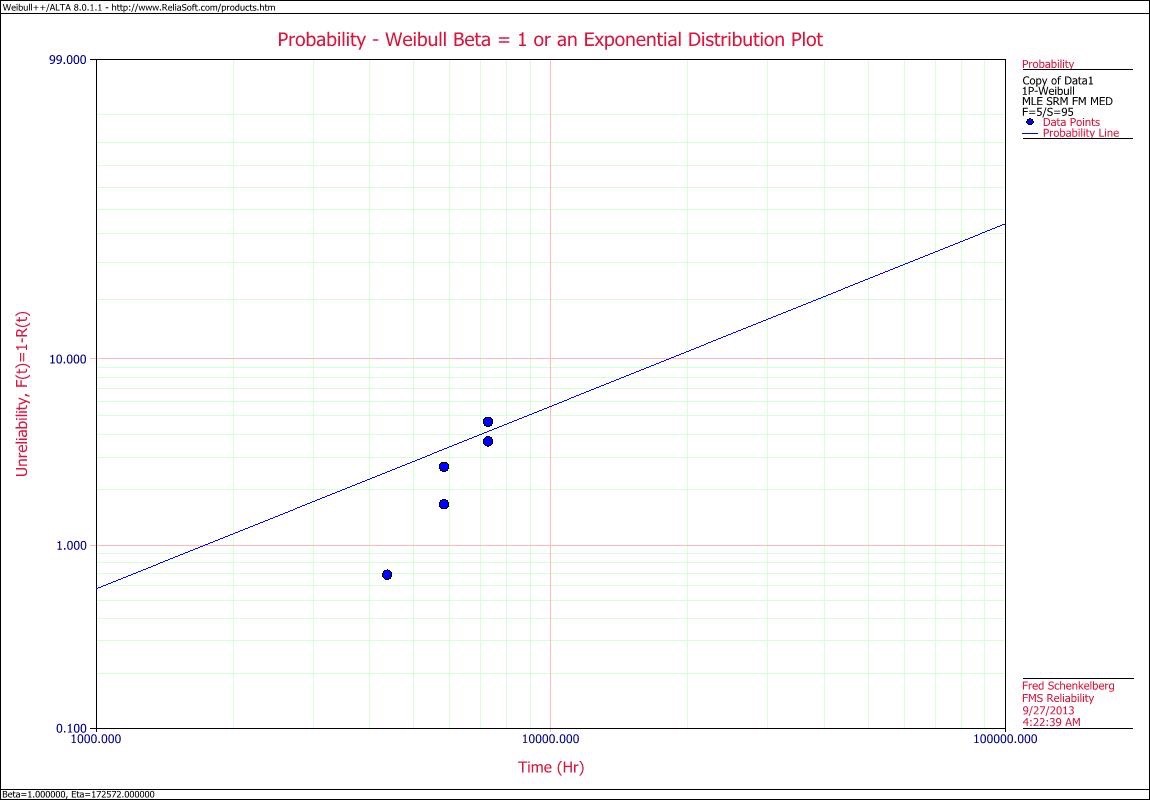
The line intersects the point where the F(t) is 0.63 or about the 63rd percentile of the distribution, and the time is at the point we calculated as the MTBF value (off to the right of the plot area).
Like me, you may notice the line doesn’t seem to describe the data very well. It seems to have a different pattern than that described by the exponential distribution. Let’s add a fit of a Weibull distribution that also was fit to the data, including the units that have not failed.


W v E plot

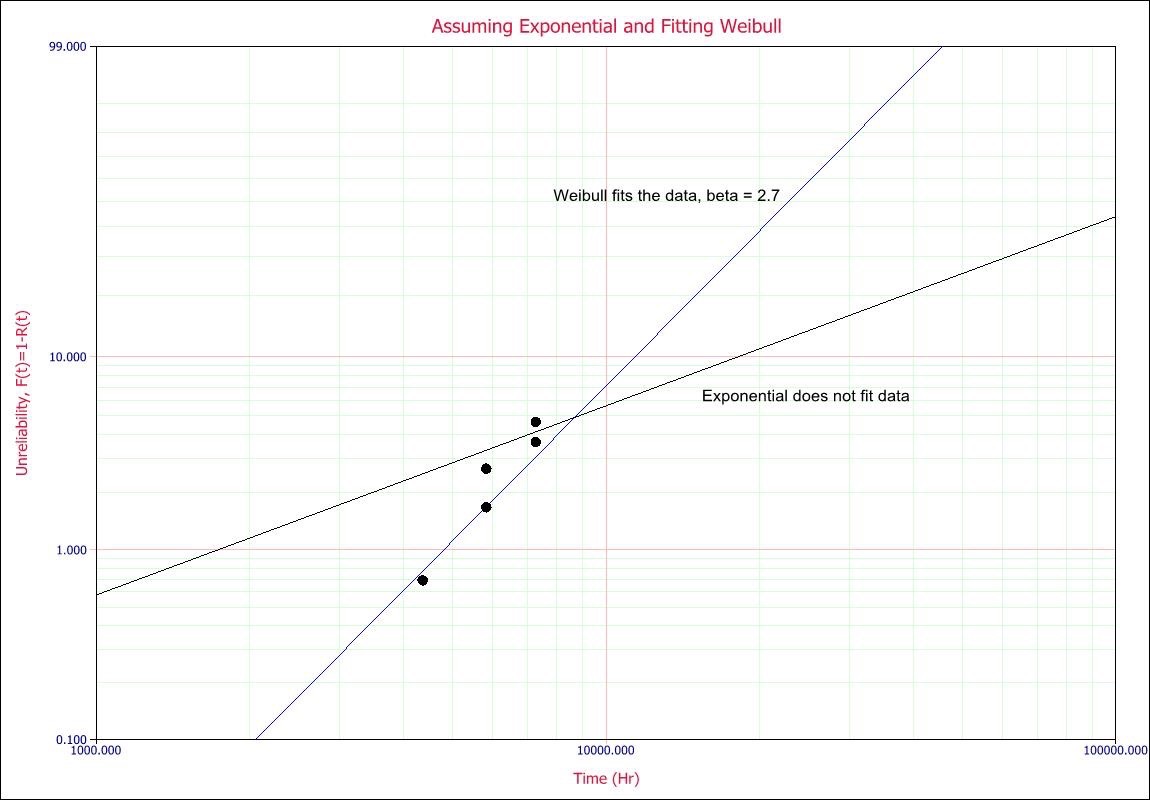
The Weibull fit at least appears to represent the pattern of the failures. The slope is much steeper than the exponential fit. The Weibull tells a different story. A story that represents the story within the data.

Again, just plot the data. Let the data show you what it has to say. What does your data say today?

The Fear of Reliability Statistics

The Fear of
Reliability Statistics

Eva the Weaver Soon deniable
Eva the Weaver
Soon deniable

When reading a report and there is a large complex formula, maybe a derivation, do you just skip over it? Does a phrase, 95% confidence of 98% reliability over 2 years, not help your understanding of the result?

Hypothesis testing, confidence intervals, point estimates, parameters, independent identically distributed, random sample, orthogonal array, …

Did you just shiver a bit?  Continue reading The Fear of Reliability Statistics

How Many Assumptions Are Too Many Concerning Reliability?

How Many Assumptions Are Too Many Concerning Reliability?

photolibrarian Riceville, Iowa, Riceville Hatchery, Ames Reliable Products
photolibrarian
Riceville, Iowa, Riceville Hatchery, Ames Reliable Products

When I buy a product, say a laptop, I am making an educated guess that Apple has done the due diligence to create a laptop that will work as long as I expect it to last. The trouble is I don’t know how long I want it to last thus creating some uncertainty for the folks at Apple. How long should a product last to meet customer expectations when customers are not sure themselves? Continue reading How Many Assumptions Are Too Many Concerning Reliability?

When to Use MTBF as a Metric?

When to Use MTBF as a Metric?

Sean Bonner Old Reliable Coffee
Sean Bonner
Old Reliable Coffee

I will not say ‘never’, which is probably what you expect. There are a rare set of circumstances which may benefit with the use of MTBF as a metric. Of course, this does not include being deceitful or misleading with marketing materials. There may actually be an occasion where the MTBF metric works well.

As you know, MTBF is often estimated by tallying up the total hours of operation of a set of devices or systems and dividing by the number of failures. If no failures occur we assume one failure to avoid dividing by zero (messy business dividing by zero and to be avoided). MTBF is essentially the average time to failure.

Expected Value as Metric

The metric we select should be measurable and of a measure we have an interest. We would like to detect changes, measure progress, and possibly make business decisions with our metrics. If we are interested in the expected value of the time to failure for our devices, then MTBF might just be useful.

When making a device we often hear of executives, engineers and customers talk about how long they expect the product to last. An office device may have an expected life of 5 years, a solar power system – 30 years, and so on. If by duration we all agree that we expect 5 years of service on average, then using the average as the metric makes sense.

Before starting the use of MTBF, just make sure that a 5 year life implies half or two thirds of the devices will fail by the stated duration of 5 years. Yes, if the time to failure distribution is actually described by the exponential distribution (and a few other distributions) it means that two third of the units are expected to failure by the MTBF value. Thus if we set the goal to 5 years MTBF we imply half or more of the units will fail by 5 years.

Product Testing Advantages

Having a goal helps the design and development team make decisions and eventually conduct testing to prove the design meets the reliability objectives. Setting the goal a the expected value allows the fewest number of samples for testing. Testing for 99% reliability over 5 years is much tougher. We may require many samples to determine a meaningful estimate of the leading tail (i.e. first 1% or 5% of failures) of the time to failure distribution.

If the time failure pattern fits an exponential distribution, then testing becomes simplified. We can test one unit for a long time, or many units a short time, and arrive at the same answer. The test planning can maximize our resources to efficiently prove our design meets the objective. When the chance of failure each hour is the same, every device-hour of testing provide an equal amount of information.

Unlike products that wear out or degrade with time, when the design and device exhibit an exponential distribution we do not need any aging studies. We can just apply use or accelerated stress and measure the hours of operation and count the failures. Also any early failures are obviously quality issues and most likely do not count toward failures that represent actual field failures. Or do they?

Metrics Should Have a Common Understanding

When the industry, organization, vendors, and engineering staff already use MTBF to discuss reliability, then management would be wise to establish a metric using MTBF. Makes sense, right? The formula to calculate MTBF is very simple. Even the name implies the meaning (no pun intended). MTBF is the mean time between (or before) failure. It’s an average, which calculators, spreadsheets, smart phones, and possibly even your watch can calculate.

While the spread of the data is often of importance when making comparisons, estimating a sample set of data’s confidence bounds, or estimating the number of failures over the warranty period, if we assume the data actually fits an exponential distribution, we find the mean equals the standard deviation. Great! One less calculation. We have what we need to move forward.

Nearly every reliability or quality textbook or guideline includes extensive discussions about MTBF the exponential distribution and a wide range of reliability related calculations. Our common understanding generally is supported by the plentiful references.

Ask a few folks around you when considering using MTBF. What do they define MTBF as representing? If you receive a consistent answer, you may just have a common understanding. If the understanding is also aligned with the underlying math and assumptions, even better.

When to Use MTBF Checklist

In summary all you need is:

  • A business interest in the time till half or more of product fail
  • A design with a fixed chance to failure each hour of operation
  • A well educated team that understands the proper use of an inverse failure rate measure

I submit we are rarely interested in the time till the bulk of devices fail, rather interested in the time to first failures or some small percentage fail

I suggest that very few devices or system actually fail with a constant hazard rate. If your product does, prove it without grand waves of assumptions.

I have found that engineers, scientists, vendors, customers, and manager regularly misunderstand MTBF and how to properly use an MTBF value.

So back to the opening statement, it is possible though not likely you will find an occasion to effectively use MTBF as a metric. Instead use reliability: the probability of successful operation over a stated period with stated conditions and definition of success. 98% of office printers will function for 5 years without failure in a office…. Pretty clear. Sure we can fully define the function(s) and environment, and we need to do that anyway.

Looking Forward to the MTBF Report

Looking Forward to the MTBF Report

photolibrarian Matchbook, Jack Knarr, Reliable Cleaners, West Union, Iowa https://www.flickr.com/photos/photolibrarian/8127780278/in/gallery-fms95032-72157649635411636/
photolibrarian
Matchbook, Jack Knarr, Reliable Cleaners,West Union, Iowa

On social media the other day ran across a comment from someone that took my breath away. They were looking forward to starting a new reliability, no, MTBF report. They were tasked with creating a measure of reliability for use across the company and they choose MTBF.

Sigh.

Where have we gone wrong?

I certainly do not blame the person. They have read about MTBF in many textbooks. Studied reliability using MTBF and related measures, plus found technical papers using the same. They may have seen industry reports and standards also.

MTBF is prevalent and no wonder someone tasked with setting a metric would select MTBF. It’s easy to calculate. Just one number and bigger is better.

On the other hand

MTBF is roundly criticized across any reliability related forum or discussion group. There is progress in books, papers and standards. And, it’s not reaching those new to reliability engineering.

This note will be short and have one request. Please tell those just getting started in reliability engineering to please not consider using MTBF. To not request MTBF from vendors. And, to actually do some thinking before selecting MTBF as their organizations metric.

Better yet, challenge those using MTBF to explain in a coherent and rational manner why they are doing so. Ask them to validate their assumed constant failure rate or similar assumptions. Working together we can start a ripple that may help build the wave of knowledge to improve the state of reliability engineering.

Fixing Early Life Failures Can Make Your MTBF Worse

Fixing Early Life Failures Can Make Your MTBF Worse


change in MTBFLet’s say we 6 months of life data on 100 units. We’re charged with looking at the data and determine the impact of fixing the problems that caused the earliest failures.

The initial look of the data includes 9 failures and 91 suspensions. Other then the nine all units operated for 180 days. The MTBF is about 24k days. Having heard about Weibull plotting and using the beta value as a guide initially find the blue line in the plot. The beta value is less than one so we start looking for supply chain, manufacturing or installation caused failures, as we suspect early life failures dominant the time to failure pattern.

Initial Steps to Improve the Product

Given clues and evidence that some of the products failed early we investigate and find evidence of damage to units during installation. In fact it appears the first four failures were due to installation damage. The fix will cost some money, so the director of engineer asks for an estimate of the effect of the change on the reliability of the system.

The organization uses MTBF as does the customer. The existing MTBF of 24k days exceeds the customers requirement of 10K days, yet avoiding early problems may be worth the customer good will. The motivation is driven by continuous improvement and not out of necessity or customer complaints.

Calculation of Impact of Change on Reliability

One way to estimate the effect of a removal of a failure mechanism is to examine the data without counting the removed failure mechanism. So, if the change to the installation practice in the best case completely prevents the initial four failures observed we are left with just the 5 other failures that occurred over the 6 months.

Removing the four initial failures and calculating MTBF we estimate MTBF will change to about 300 days.

Hum?

We removed failures and the MTBF got worse?

What Could Cause this Kind of Change?

The classic calculation for MTBF is the total time divided by the number of failures. Taking a closer look at time to failure behavior of the two different failure mechanisms may reveal what is happening. The early failures have a decreasing failure rate (Weibull beta parameter less than 1) over the first two months of operation. Later, in the last couple of months of operation, 5 failures occur and they appear to have an increasing rate of failure (Weibull beta parameter greater than 1).

By removing the four early failures the Weibull distribution fit changes from the blue line to the black line (steeper slope).

Recall that the MTBF value represents the point in time when about 63% of units have failed. With only 9 total failures out of 100 units we have only about 10% of units failed so the MTBF calculation is a projects to the future when most of have failed, it does not providing information about failures at 6 months or less directly.

In this case when the four early failures are removed the slope changed from about 0.7 to about 5, it rotated counter clockwise on the CDF plot.

If only using MTBF the results of removing four failures from the data made the measured MTBF much worse and would have prevented us from improving the product. By fitting the data to a Weibull distribution we learned to investigate early life failures, plus once that failure mechanism was removed revealed a potentially serious wear out failure mechanism.

This is an artificial example, of course, yet it illustrates the degree which an organization is blind to what is actually occurring by using only MTBF. Treat the data well and use multiple methods to understand the time to failure pattern.

The Reliability Metric Book Announcement

The Reliability Metric

A Quick and Valuable Improvement Over MTBF

The-Reliability-Metric-cover-230x300Finished it. 130 pages long and packed with advice on why and how to switch from MTBF to reliability.

Based in large part on comments, feedback, discussions and input from you, my peers in the NoMTBF tribe. Thanks for the encouragement and support.

The Reliability Metric book is available here. Continue reading The Reliability Metric Book Announcement

Determine MTBF Given a Weibull Distribution

Determine MTBF Given a Weibull Distribution

Gary A. K. Reliable & regal 1000-block Nelson.
Gary A. K.
Reliable & regal 1000-block Nelson.

First off, not sure why anyone would want to do this, yet one of the issues I’ve heard concerning abandoning the use of MTBF is client ask for MTBF. If they will not accept reliability probabilities at specific durations, and insist on using MTBF, you probably should provide a value to them.

Let’s say you have a Weibull distribution model that described the time to failure distribution of your product. You’ve done the testing, modeling, and many field data analysis and know for the requestor’s application this is the best estimate of reliability performance. You can, quite easily calculate the MTBF value.

As you know, if theβ parameter is equal to one then the characteristic life, η, is equal to MTBF. If β is less than or greater than one, then use the following formula to determine the mean value, MTBF, for the distribution.

\displaystyle \mu =\eta \Gamma \left( 1+\frac{1}{\beta } \right)

You’ll need the Gamma function and the Weibull parameters. The further β is from one, the bigger the difference between η and MTBF.

You can find a little more information and background at the article Calculate the Mean and Variance on the accendoreliability.com site under the CRE Preparation article series.

MTBF in the Age of Physics of Failure

MTBF in the Age of Physics of Failure

Elizabeth "Reliable" https://www.flickr.com/photos/goosedancer/3733356197/in/gallery-fms95032-72157649635411636/
Elizabeth
“Reliable”
https://www.flickr.com/photos/goosedancer/3733356197/in/gallery-fms95032-72157649635411636/

MTBF is the inverse of a failure rate, it is not reliability. Physics of failure (PoF) is a fundamental understanding and modeling of failure mechanisms. It’s the chemistry or physical activity that leads a functional product to fail. PoF is also not reliability.

Both MTBF and PoF have the capability to estimate or describe the time to failure behavior for a product. MTBF requires the knowledge of the underlying distribution of the data. PoF requires the use stresses and duration to allow a calculation of the expected probability of success over time.

MTBF start with a point estimate. PoF starts with the relationship of stress on the deterioration or damage to the material. One starts with time to failure data and consolidates into a single value, the other starts with determining the failure mechanism model.

Does MTBF has a Role Anymore?

Given the ability to model at the failure mechanism level even for a complex system, is there a need to summarize the time to failure information into a single value?

No.

MTBF was convenient when we had limited computing power and little understanding of failure mechanisms. Today, we can use the time to failure distributions directly. We can accommodate different stresses, different use pattern and thousands of potential failure mechanisms on a laptop computer.

MTBF has no purpose anymore. MTBF describes something we have and should have little interest in knowing.

Sure, PoF modeling takes time and resources to create. Sure, we may need complex mathematical models to adequately describe a failure mechanism. And, we may need to use simulation tools to estimate time to failure across a range of use and environmental conditions. Yet, it provide an estimate of reliability that is not possible using MTBF at any point in the process. PoF provides a means to support design and production decisions, to accommodate the changing nature of failure rates given specific experiences.

When will PoF become dominant?

When will we stop using MTBF? I think the answer to both is about the same time. It is going to happen when we, reliability minded professionals, decide to use the best available methods to create information that support the many decisions we have to make. PoF will become dominant soon. It provides superior information and superior decision, thus superior products. The market will eventually decide, and everyone will have to follow. Or, we can decide now to provide our customers reliable products.

We can help PoF become dominant by not waiting for it to become dominant.

Adjusting Parameters to Achieve MTBF Requirement

 How to Adjust Parameters to Achieve MTBF

Alex Ford, Reliable Loan & Jewelry | | Isaac's
Alex Ford, Reliable Loan & Jewelry | | Isaac’s

A troublesome question arrived via email the other day. The author wanted to know if I knew how and could help them adjust the parameters of a parts count prediction such that they arrived at the customer’s required MTBF value.

I was blunt with my response. Continue reading Adjusting Parameters to Achieve MTBF Requirement

I’ll have some Pi, you can have the MTBF


FoodApplePie.jpg
Picture of a pie from Wikipedia

Do you know what an irrational number is? It is a number that cannot be expressed as a definite number but is often a useful shortcut in performing complex mathematical calculations. Pi is an irrational number that provides a very useful shortcut in calculating the circumference, area, surface, and volume of round things. Pi happens to be my favorite irrational number because you get to celebrate it, if you follow the western calendar, every March 14th (3.14 are the first three digits in Pi) by eating a nice big piece of pie (Pi sounds like pie and pies are round).

Do you know any other irrational numbers? I do. Mean Time Between Failure (MTBF) and variants of it such as Mean Time To Failure (MTTF) are irrational numbers. But they are not irrational in a good and useful way like Pi is. Sure, MTBF once had some usefulness to it and provided a useful shortcut for some reliability, maintenance, and logistics applications, but it has become so misused that it had become irrational in the primary definition of the word irrational that MTBF is something that is not logical, not reasonable, groundless, baseless, and not justifiable.

So how did MTBF, a once useful thing, get to be so irrational?

Here are some reasons:

  1. Apparently, to make the logistics for large populations of items simpler, people took the failure rate of the item and inverted it to create MTBF. They did this mostly out of convenience when dealing with large populations such as fleets of vehicles to address the random failures that were being experienced and to make the mathematics simple. And this approach worked fairly well before better approaches came into play. But this approach also worked fairly well because other reliability and maintainability practices were also enforced, namely planned/preventive/scheduled maintenance whereby serviceable items were serviced to keep them in proper operating condition, wearable items were replaced or restored, life limited items were replaced and good operating and failure data was kept. Without enforcing the maintainability and good data side of this, MTBF becomes very misleading.
  2. Then people who didn’t understand that MTBF was the failure rate of an item inverted began to take the “mean time” in MTBF a bit too literally, ignoring the fact that most items have a limited useful life, and began thinking that MTBF was some sort of indication of the mean life of the item. You can have an electrolytic capacitor that has a failure rate of 0.0000001 failures per operating hour and invert that to get a MTBF of 10,000,000 hours. Does that mean that a single capacitor will last for 10,000,000 hours or 1,142 years? Of course not. Because the capacitor may only have a useful life of 5 to 20 years before it leaks and dries out and fails. Whenever you use MTBF or even Failure Rate, you not only need to know that number but you also need to know over what useful life the number is valid.
  3. Then people started collecting failure rate data and putting it in databases and selling reliability analysis packages that enabled people to predict the MTBF of complex systems with hundreds and thousands of components in them. That made MTBF predictions very easy to do and people were too lazy in not also indicating the relevant useful life limits of life limited components in the system. But the MTBF numbers that the computer models spit out were big numbers and that made people very happy. Naïve and unaware, but happy. Except for the poor guys who had to use the systems struggled with the systems not performing as promised and then being blamed when the systems didn’t perform.
  4. Then people stopped collecting failure rate data and now the databases underlying many of the computer models still in use today not only have misleading data but also have outdated and obsolete data.

Irrational numbers indeed. To me, a self-professed Reliability subject matter expert, MTBF just confuses me and causes confusion. So I say to stay away from it as much as you can.

So, what should you do?

The best thing to do is to not use MTBF and instead use Failure Rate. And when you use failure rate, make sure that you are using and representing it properly by stating the failure rate during the intended time period. Most of the time, people are interested in knowing the expected failure rate of something over its useful life. So, you may indicate that an item has an expected failure rate of 0.000001 failures per operating hour over its 10 year expected useful life. Some people write this as a failure rate of 1E-6 per hour over its 10 year useful life (there are other failure rate conventions used such as FIT rate that I won’t go into). If the customer knows failure rate over the expected useful life, they then know two very useful things; how long they should expect the product to last and how reliable they can expect the product to be. And if customers know these two things, they can plan for the support, spares, maintenance, and replacement of items they need to be doing to keep their products or systems up and running.

One example is that you may use a non-repairable power supply in your system that has an expected usage life of 10 years and a very low failure rate during those 10 years. But what if you need your system to run for 20 or even 30 years? You either need to find a power supply with a longer life or be prepared to replace the power supply proactively before it nears its end of life. You should also design your system so that it is easy to replace the power supply.

When repairable items are involved, the maintenance required should be indicated so that the customer knows what they need to do to preserve the performance of their product or system. One example is that you should expect your car to last for 200,000 miles, but you need to stick to the recommended maintenance schedule to ensure this. If you decide to never change the oil in your car, you should not expect it to last for 200,000 miles and certainly should not expect it to perform reliably.

How do you get failure rate?

You can get failure rate a few ways:

  1. Most component data sheets indicate Failure Rate or how to calculate it based on certain use and environmental parameters. Some data sheets even indicate MTBF, so make sure to invert it to get Failure Rate. And do not forget to look for information that shows or explains the useful life that you can expect for the component so that you have both pieces of information that you need; failure rate over what expected useful life. This gives you a decent engineering estimate for useful life and reliability until you have actual data for your product.
  2. You can conduct testing or even accelerated testing on products to determine their failure rate. However, you may need a lot of samples and incur a lot of cost to test to demonstrate a certain reliability or failure rate.
  3. The best way to get failure rate, in my opinion, is to get it from your own products in service. You need to collect data either on the entire product population or a large enough sample population to know the actual number of units in service, operating hours, and failures. You can then develop your own failure rates for your products that reflect the markets you serve and how your product is used.

Move away from the irrational numbers

As you move away from the irrational numbers of MTBF and towards knowing the real failure rates and reliability of your products in the markets you serve and how your products are used, you will be better able to drive reliability improvement when needed, understand and correctly price warranties and service agreements, and provide confidence and satisfaction to your customers. You can then reward yourself with a nice piece of pie.

Supply Chain MTBF vs Reliability Requirements

Supply chain MTBF vs Reliability requirements

Richard Klein, Reliable of Ashland https://www.flickr.com/photos/richspk/3181592794/in/gallery-fms95032-72157649635411636/
Richard Klein, Reliable of Ashland

Let’s say you have a reliability goal for your product of 95% survive 2 years in an outdoor portable environment with the primary function of providing two way communication. There is an engineering reference specification detailing the product functions and requirements for performance. There is a complete document of environmental and use conditions . And you have similar detailed goals for the 1st month of use the expected useful life of 5 years. Continue reading Supply Chain MTBF vs Reliability Requirements

How to Estimate MTBF

How to Estimate MTBF

Eva the Weaver - no longer very reliable https://www.flickr.com/photos/evaekeblad/14504747666/in/gallery-fms95032-72157649635411636/
Eva the Weaver – no longer very reliable

Every now and then I receive an interesting question from a connection, colleague or friend. The questions that make me think or they discussion may be of value to you, I write a blog post.

In this case, there are a couple of interesting points to consider. Hopefully you are not facing a similar question. Continue reading How to Estimate MTBF

What do we know given MTBF?

What do we know with MTBF

Tom Magliery Reliable
Tom Magliery
Reliable

How many times have you been given only MTBF, a single value? The data sheet or sales representative or website provides only MTBF and nothing more. We see it all the time, right? It is provided as the total answer to “what is the reliability performance expectation?”

So, given MTBF what do we really know about reliability?

As you may suspect, not much. Continue reading What do we know given MTBF?